Investor Relations
Financial Information
Segment Information
Segment sales
(millions of yen)
| 2016/2 |
2017/2 |
2018/2 |
2019/2 |
2020/2 |
|
|---|---|---|---|---|---|
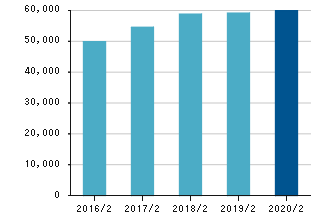
| Domestic | 49,871 | 54,575 | 58,819 | 59,153 | 59,856 |
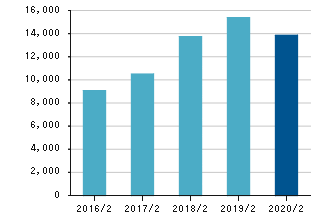
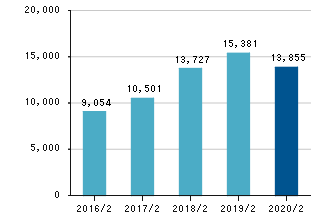
| Overseas | 9,054 | 10,501 | 13,727 | 15,382 | 13,855 |
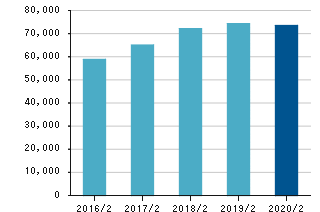
| Total | 58,831 | 65,058 | 72,174 | 74,243 | 73,492 |
*Figures in “Total” column are on a consolidated basis after the elimination of intercompany transactions.
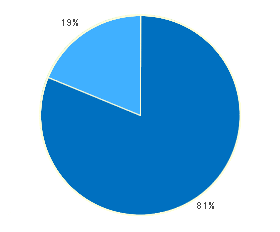
(millions of yen)
| ■ Domestic | 59,856 | |
| ■ Overseas | 13,855 |
Domestic sales
(millions of yen)
| 2016/2 |
2017/2 |
2018/2 |
2019/2 |
2020/2 |
|
|---|---|---|---|---|---|
| Total Amusement Facilities Related Sales | 49,403 | 54,220 | 58,130 | 58,622 | 59,494 |
| Amusement Machine | 39,526 | 44,137 | 48,485 | 49,995 | 51,097 |
| Product (Sales) | 9,736 | 9,935 | 9,498 | 8,348 | 8,008 |
| Consignment | 139 | 147 | 147 | 140 | 132 |
| Other | 468 | 354 | 315 | 238 | 212 |
| Total | 49,871 | 54,575 | 58,446 | 58,861 | 59,637 |
Overseas sales
(millions of yen)
| 2016/2 |
2017/2 |
2018/2 |
2019/2 |
2020/2 |
|
|---|---|---|---|---|---|
| China | 6,423 | 7,175 | 9,040 | 9,647 | 7,642 |
| Malaysia | 1,569 | 1,728 | 2,246 | 2,517 | 2,516 |
| Thailand | 634 | 668 | 762 | 727 | 744 |
| Philippines | 310 | 685 | 1,079 | 1,387 | 1,561 |
| Indonesia | 115 | 242 | 503 | 800 | 996 |
| Vietnam | - | - | 96 | 302 | 394 |
| Total | 9,054 | 10,501 | 13,727 | 15,381 | 13,855 |
Segment operating income
(millions of yen)
| 2016/2 |
2017/2 |
2018/2 |
2019/2 |
2020/2 |
|
|---|---|---|---|---|---|
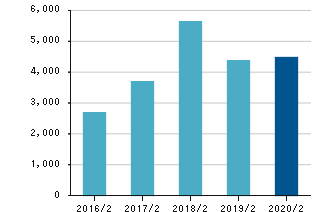
| Domestic | 2,683 | 3,686 | 5,628 | 4,363 | 4,475 |
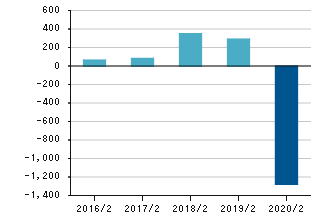
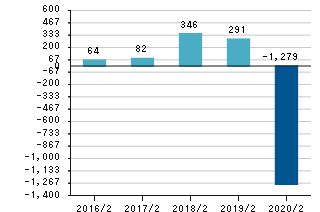
| Overseas | 64 | 82 | 346 | 291 | -1,279 |
| Total | 2,748 | 3,769 | 5,970 | 4,651 | 3,211 |
*Figures in “Total” column are on a consolidated basis after the elimination of intercompany transactions.
Overseas operating income
(millions of yen)
| 2016/2 |
2017/2 |
2018/2 |
2019/2 |
2020/2 |
|
|---|---|---|---|---|---|
| China | 185 | 198 | 304 | 58 | -1,198 |
| Malaysia | 147 | 162 | 214 | 243 | 5 |
| Thailand | △132 | △240 | △227 | △107 | -38 |
| Philippines | △49 | 2 | 22 | 31 | -83 |
| Indonesia | △38 | 1 | 49 | 99 | 79 |
| Vietnam | 8 | -1 | |||
| Total | 64 | 82 | 346 | 291 | -1,279 |

