Investor Relations
Financial Information
Management Indices

Consolidated
(millions of yen)
| 2016/2 |
2017/2 |
2018/2 |
2019/2 |
2020/2 |
|
|---|---|---|---|---|---|
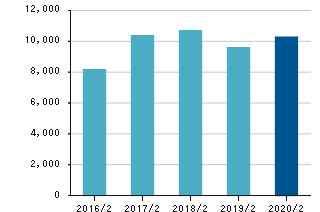
| Cash flows from operating activities | 8,156 | 10,349 | 10,672 | 9,588 | 10,271 |
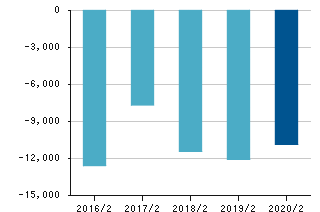
| Cash flows from investing activities | -12,571 | -7,660 | -11,416 | -12,069 | -10,849 |
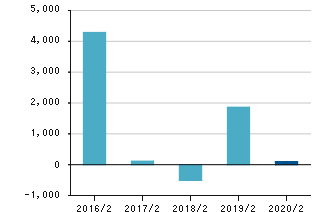
| Cash flows from financing activities | 4,285 | 112 | -506 | 1,862 | 96 |
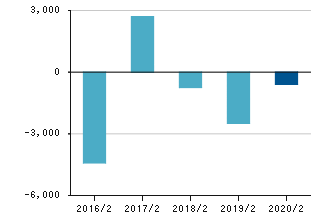
| Free cash flow | -4,414 | 2,688 | -744 | -2,480 | -578 |
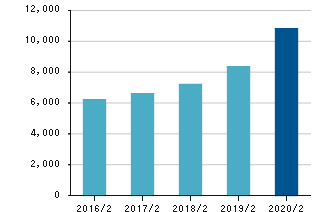
| Depreciation | 6,202 | 6,593 | 7,206 | 8,356 | 10,815 |
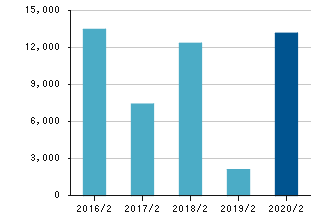
| Capital expenditures | 13,468 | 7,408 | 12,342 | 2,099 | 13,159 |
*Free cash flow= cash flows from operating activities + cash flows from investing activities