業績ハイライトFINANCIAL HIGHLIGHTS
連結
(単位 : 百万円)
| 第19期 2015/2 |
第20期 2016/2 |
第21期 2017/2 |
第22期 2018/2 |
第23期 2019/2 |
第24期 2020/2 |
第25期 2021/2 |
第26期 2022/2 |
第27期 2023/2 |
第28期 2024/2 |
第29期 2025/2 |
|
|---|---|---|---|---|---|---|---|---|---|---|---|
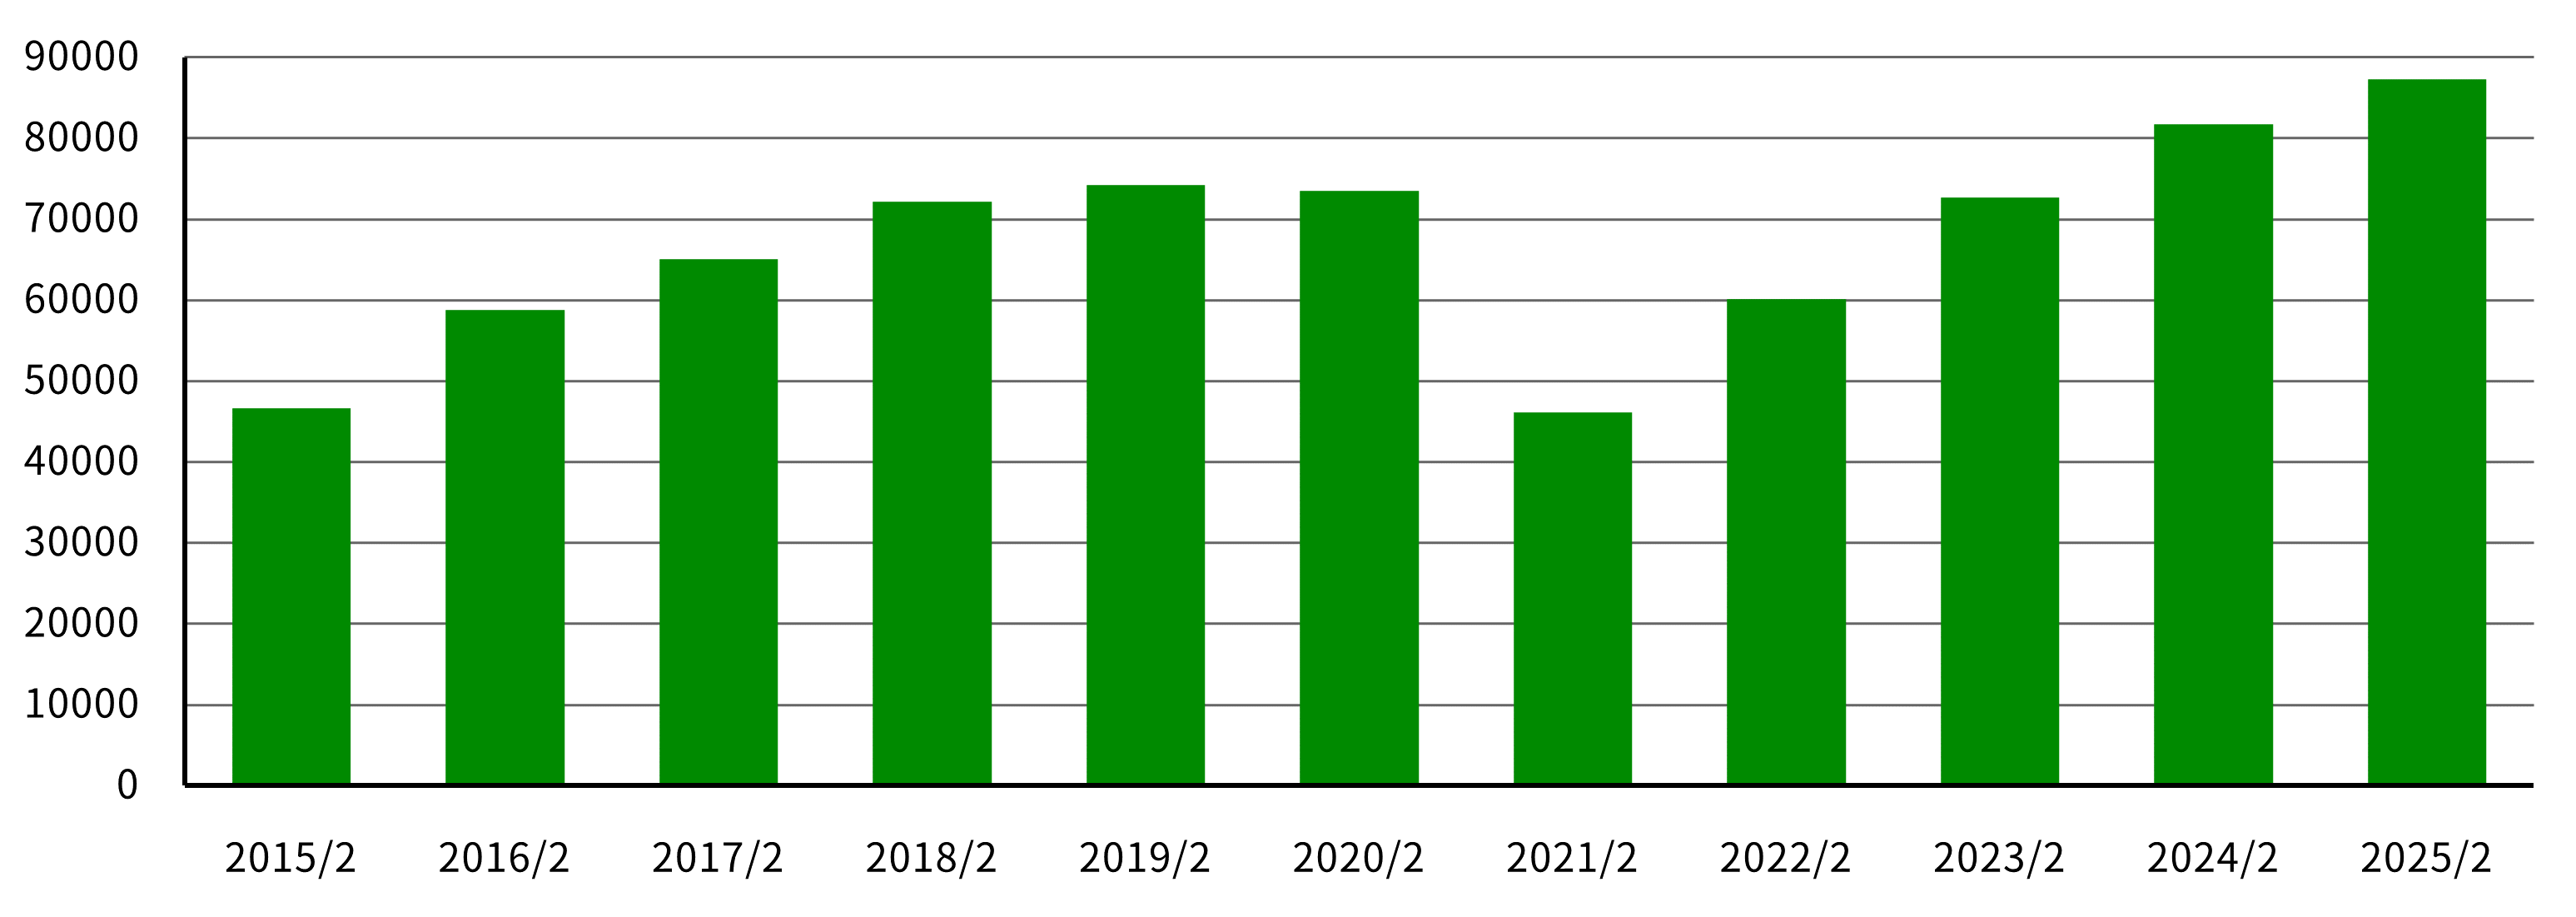
| 売上高 | 46,632 | 58,831 | 65,058 | 72,174 | 74,243 | 73,492 | 46,116 | 60,170 | 72,690 | 81,758 | 87,240 |
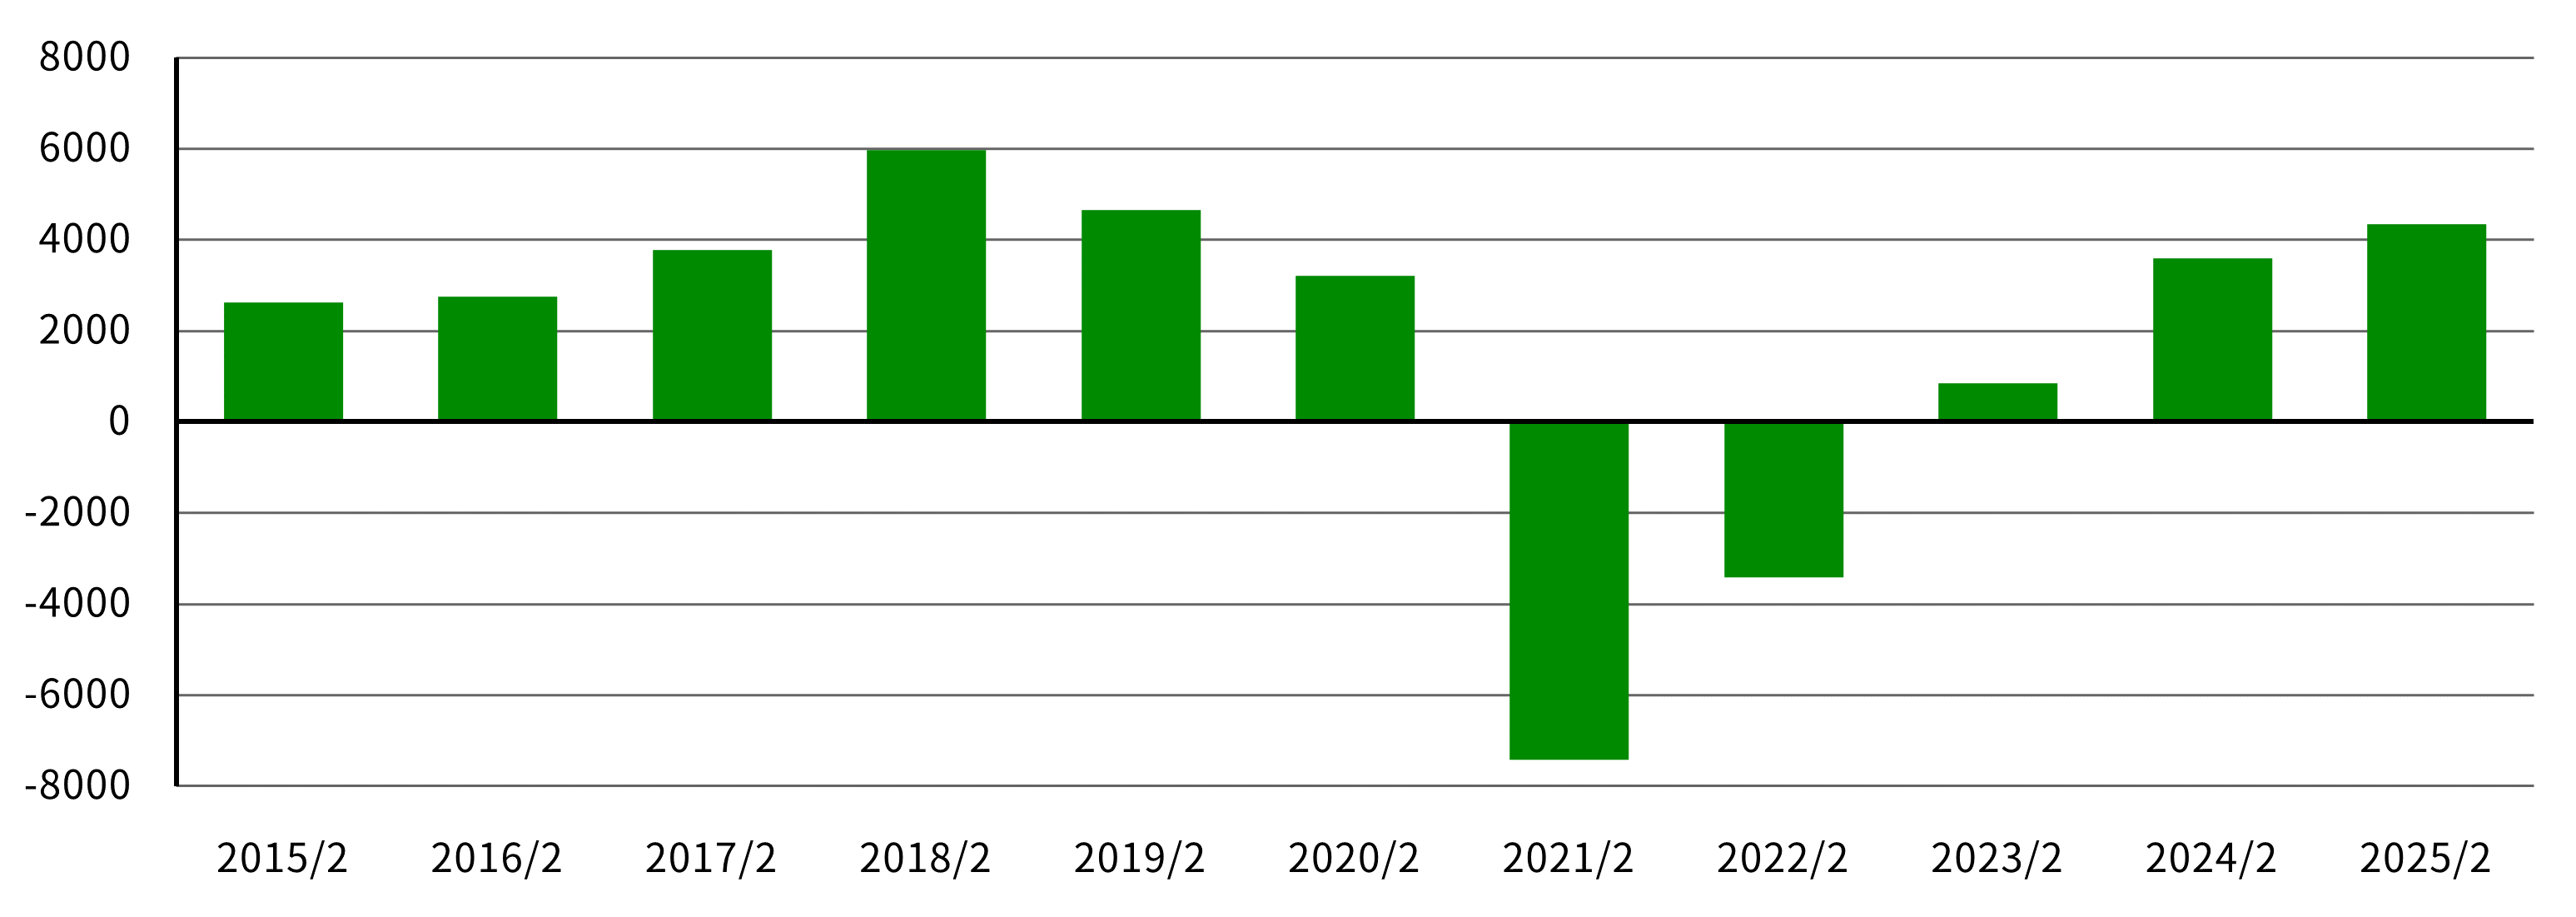
| 営業利益 | 2,629 | 2,748 | 3,769 | 5,970 | 4,651 | 3,211 | △7,429 | △3,408 | 849 | 3,585 | 4,344 |
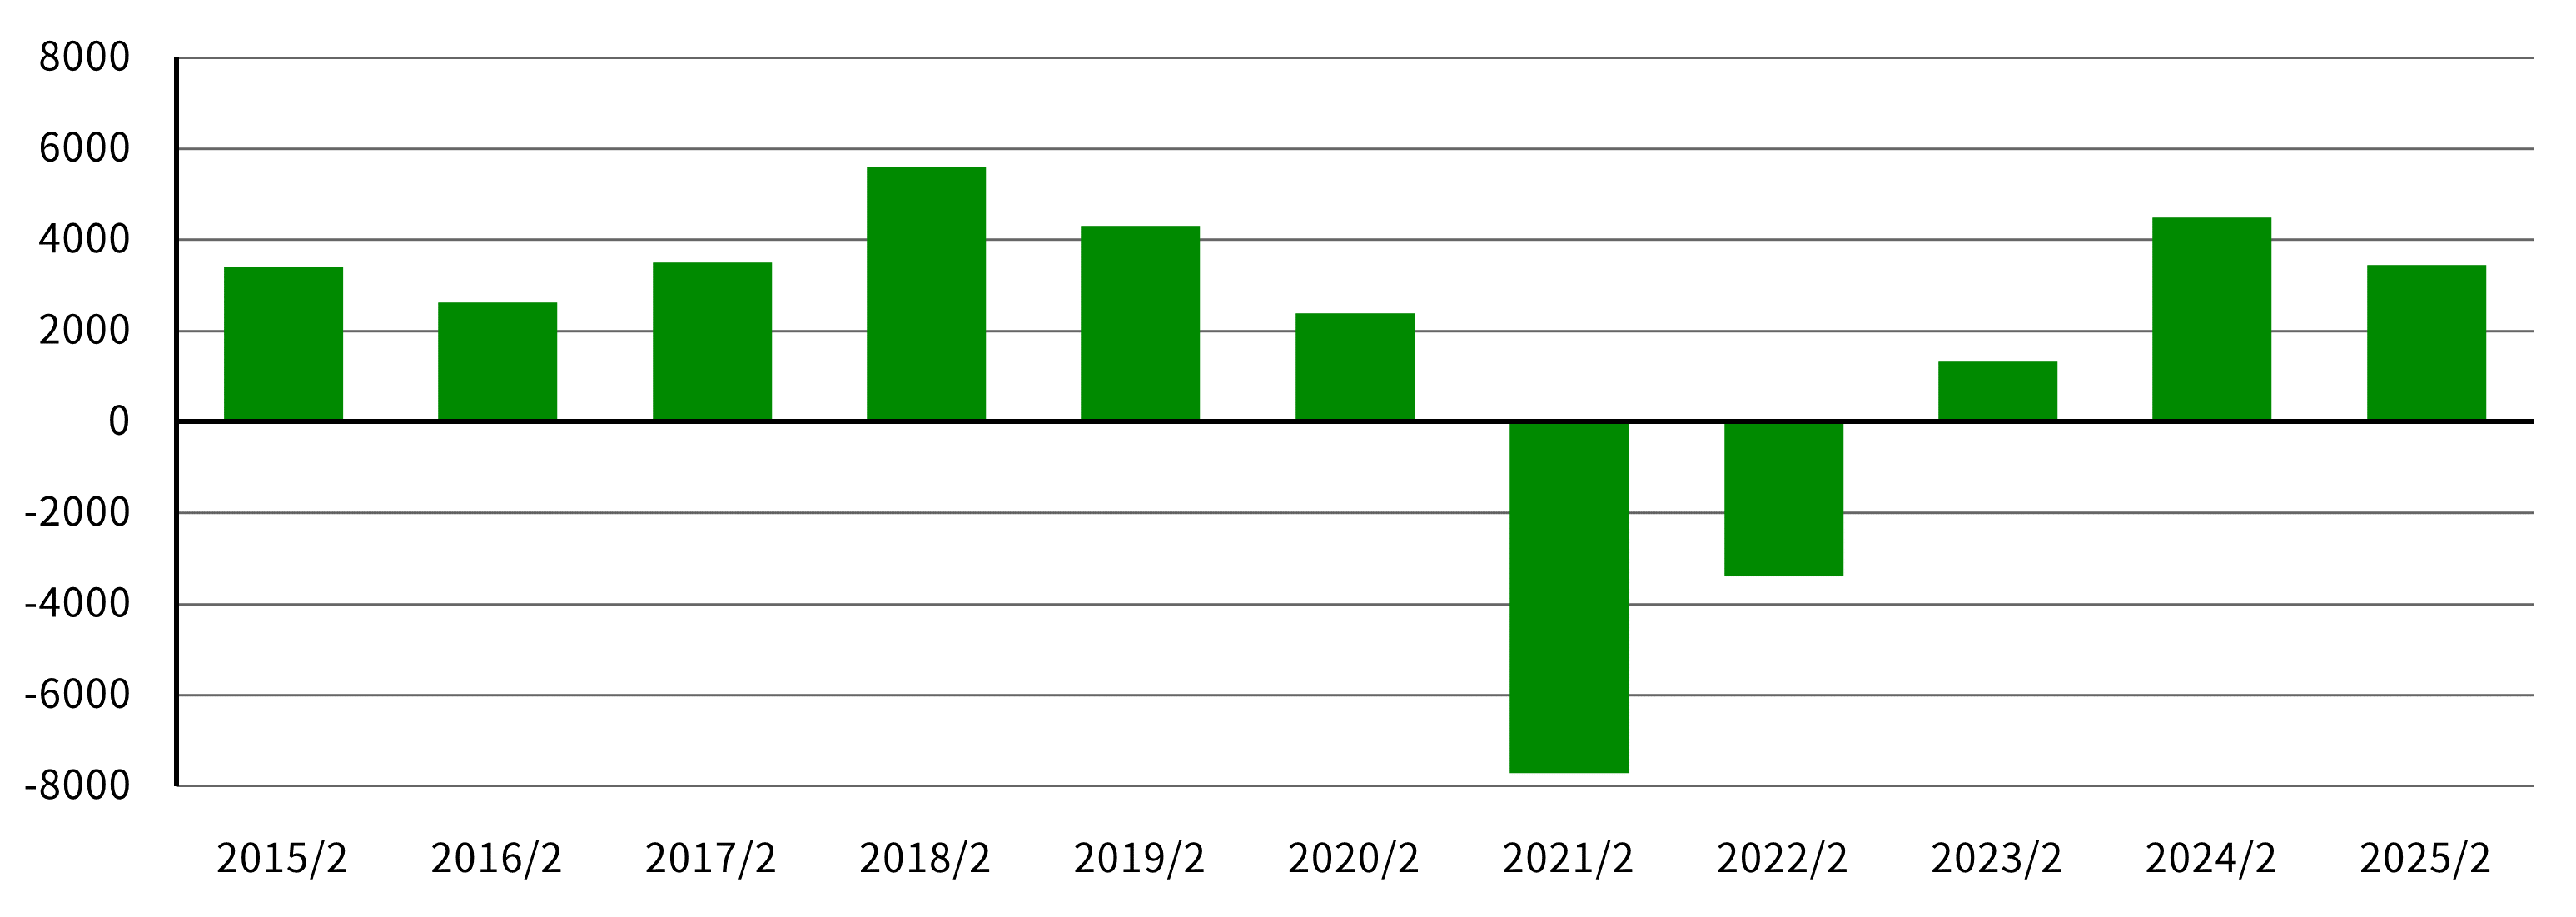
| 経常利益 | 3,417 | 2,630 | 3,498 | 5,598 | 4,299 | 2,387 | △7,719 | △3,385 | 1,318 | 4,488 | 3,440 |
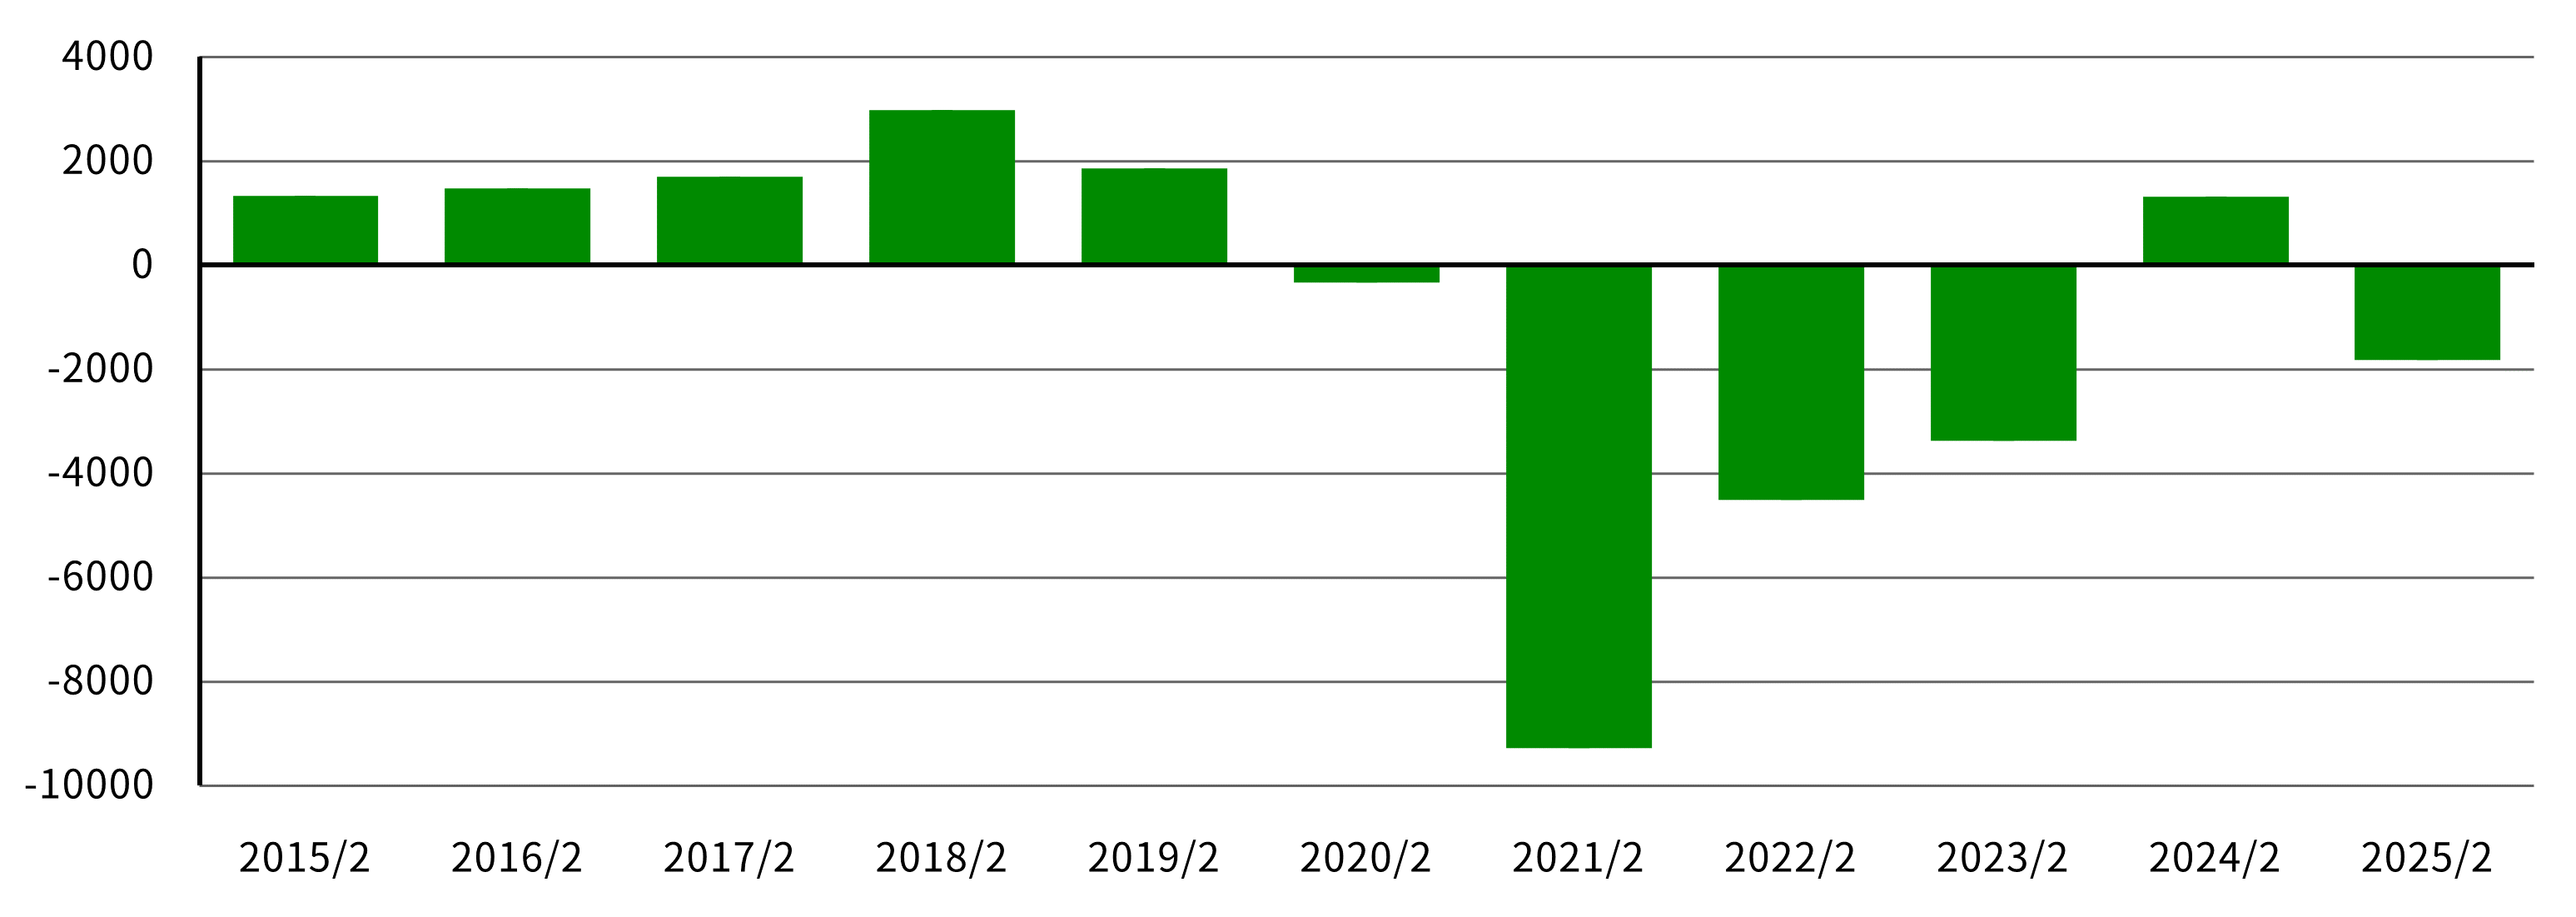
| 親会社株主に帰属する当期純利益 | 1,338 | 1,480 | 1,697 | 2,986 | 1,865 | △325 | △9,277 | △4,507 | △3,376 | 1,314 | △1,816 |
| 総資産 | 30,041 | 41,040 | 43,328 | 46,928 | 48,928 | 55,739 | 53,962 | 51,235 | 46,917 | 52,303 | 53,673 |
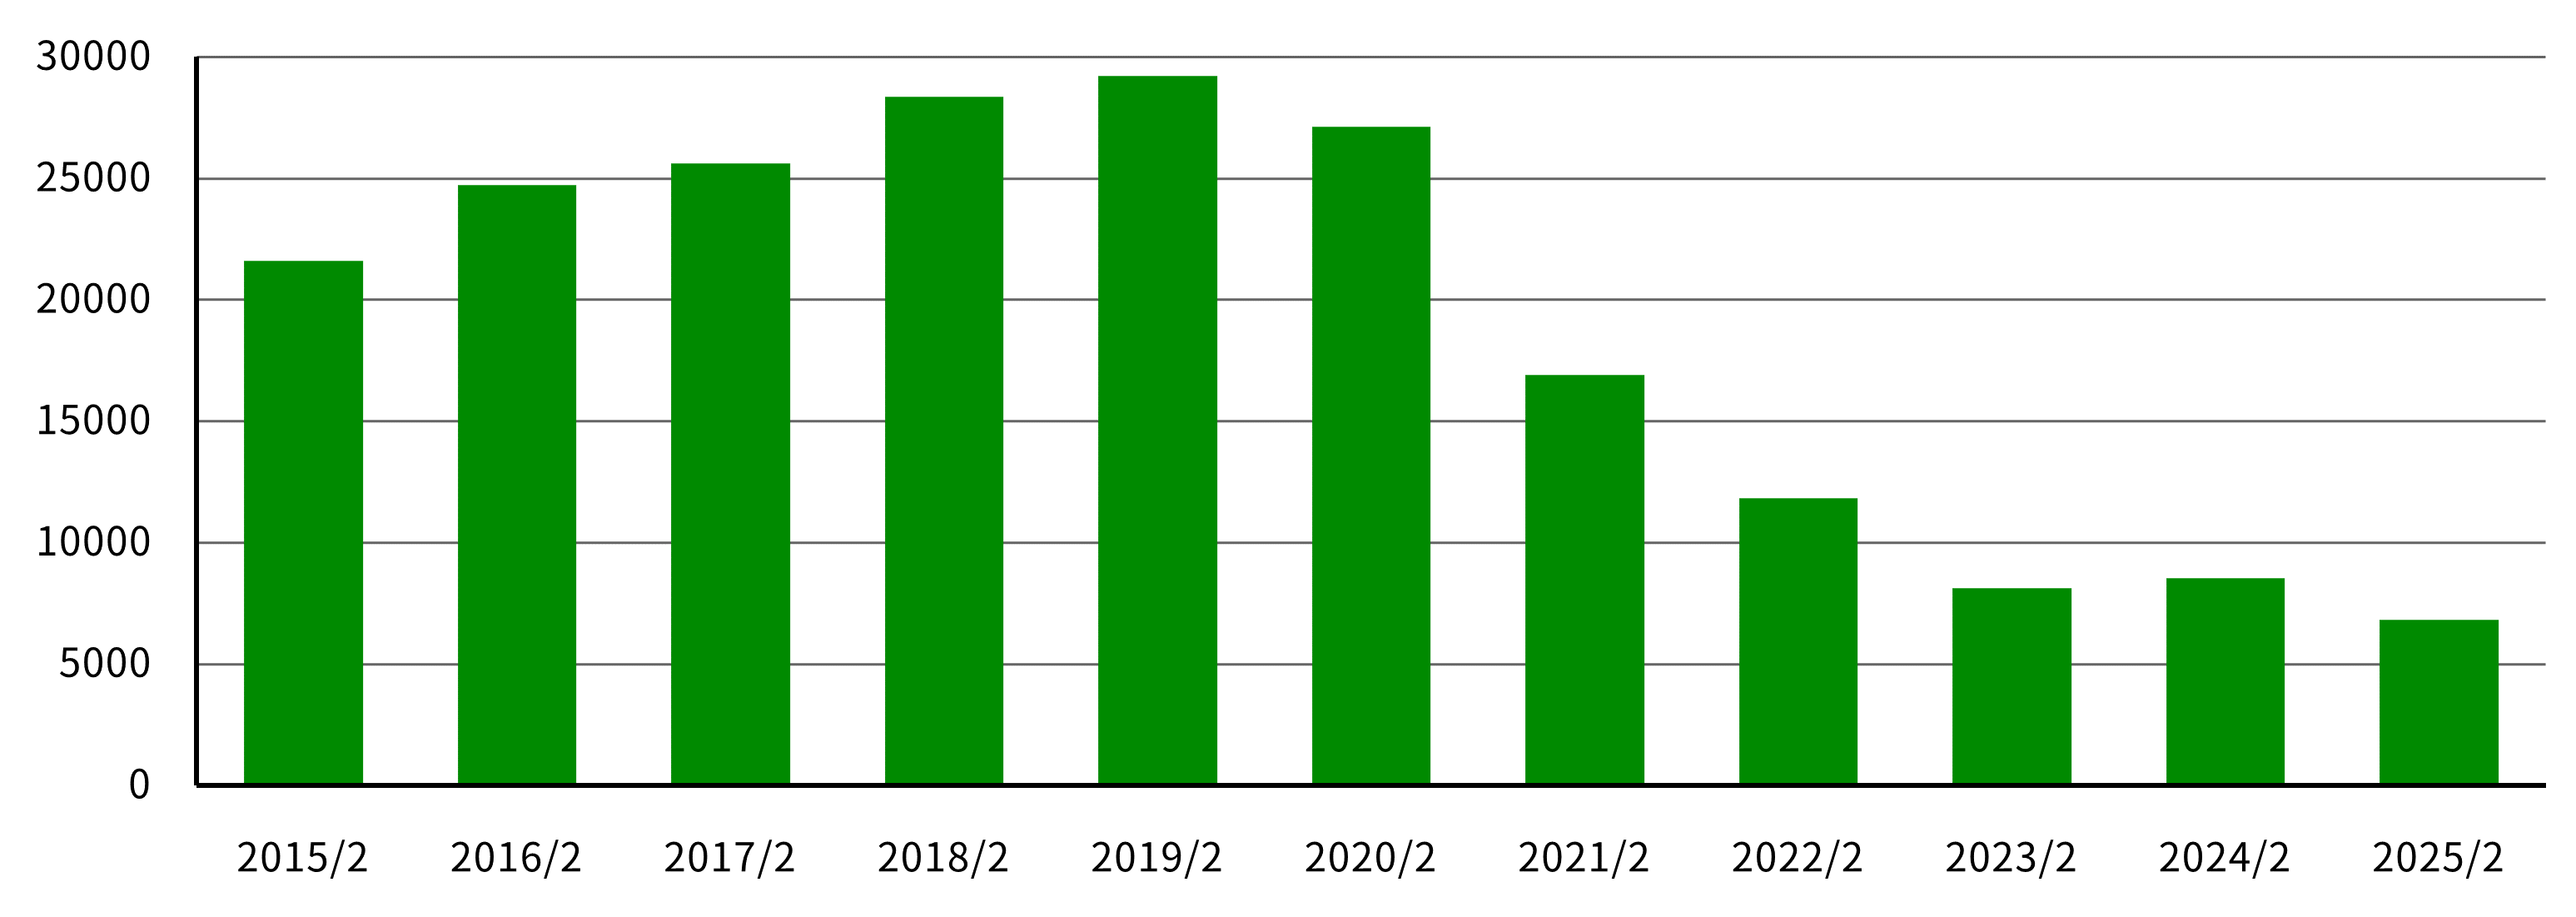
| 純資産 | 21,608 | 24,744 | 25,619 | 28,369 | 29,220 | 27,128 | 16,922 | 11,841 | 8,138 | 8,541 | 6,842 |
売上高
(単位 : 百万円)
営業利益
(単位 : 百万円)
経常利益
(単位 : 百万円)
親会社株主に帰属する当期純利益
(単位 : 百万円)
総資産
(単位 : 百万円)

純資産
(単位 : 百万円)
データダウンロード
2025年04月11日更新


