主な経営指標MANAGEMENT INDICES
連結
(単位 : %)
| 第22期 2018/2 |
第23期 2019/2 |
第24期 2020/2 |
第25期 2021/2 |
第26期 2022/2 |
第27期 2023/2 |
第28期 2024/2 |
第29期 2025/2 |
|
|---|---|---|---|---|---|---|---|---|
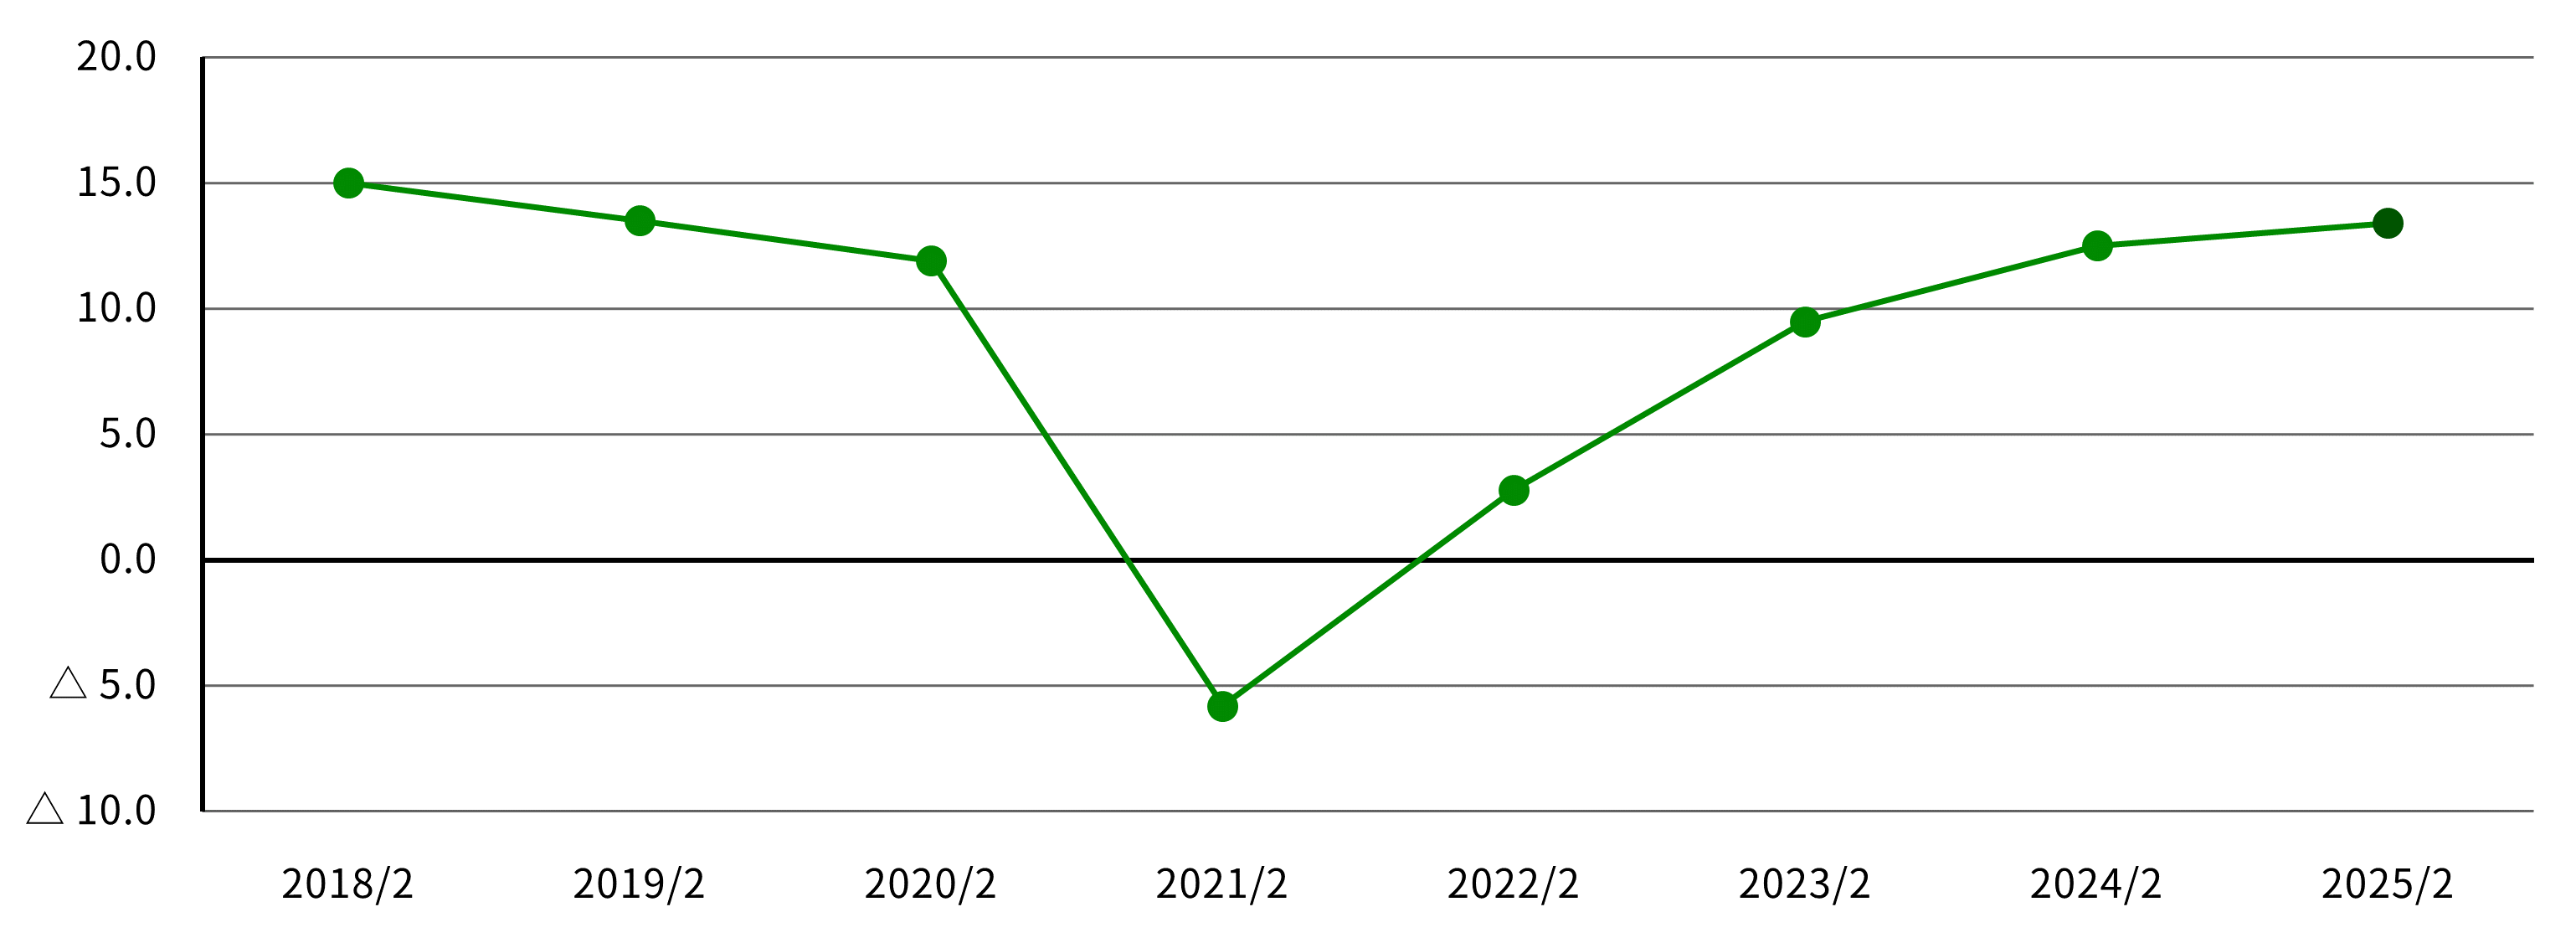
| 売上高総利益率 | 15.0 | 13.5 | 11.9 | △5.8 | 2.8 | 9.5 | 12.5 | 13.4 |
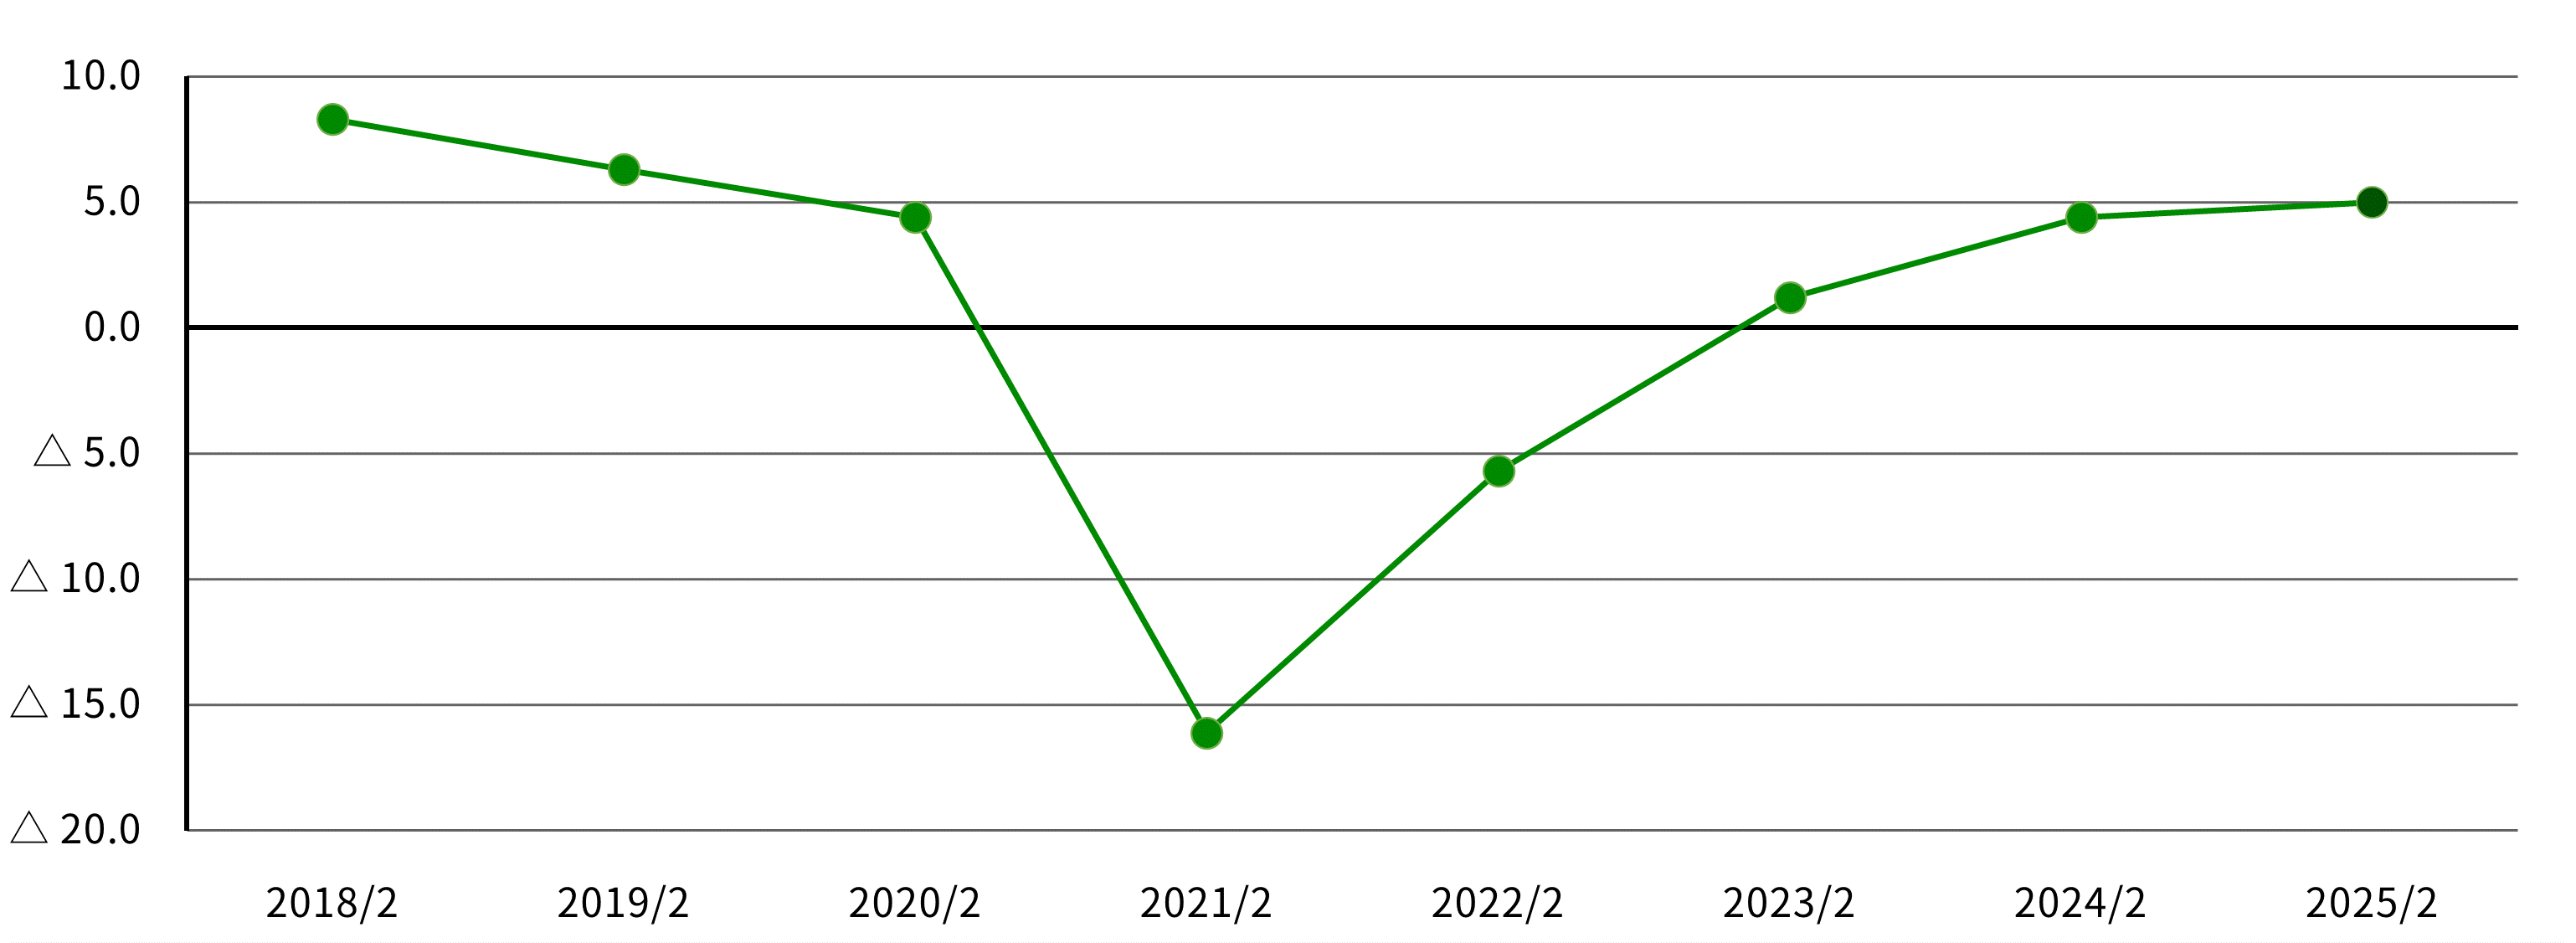
| 売上高営業利益率 | 8.3 | 6.3 | 4.4 | △16.1 | △5.7 | 1.2 | 4.4 | 5.0 |
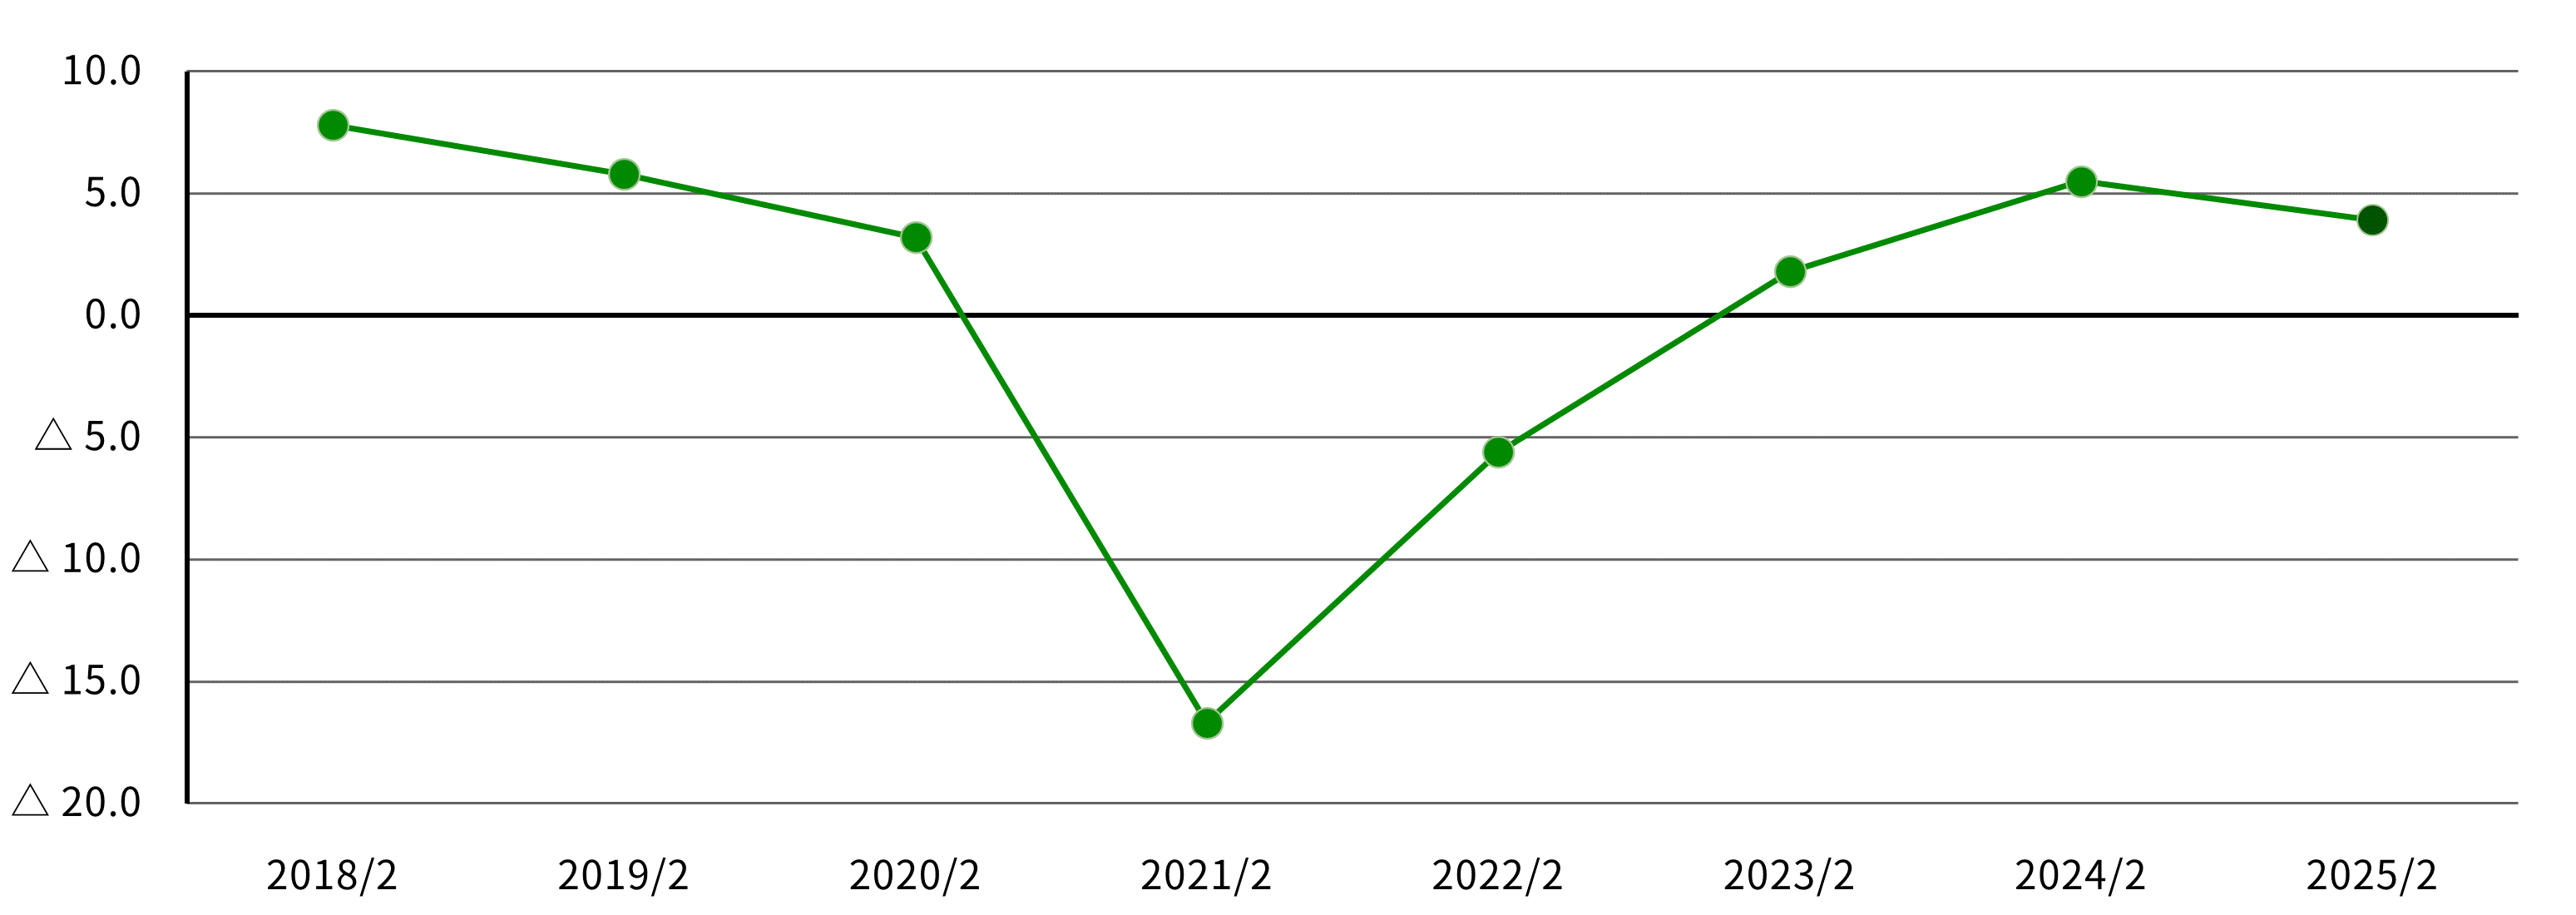
| 売上高経常利益率 | 7.8 | 5.8 | 3.2 | △16.7 | △5.6 | 1.8 | 5.5 | 3.9 |
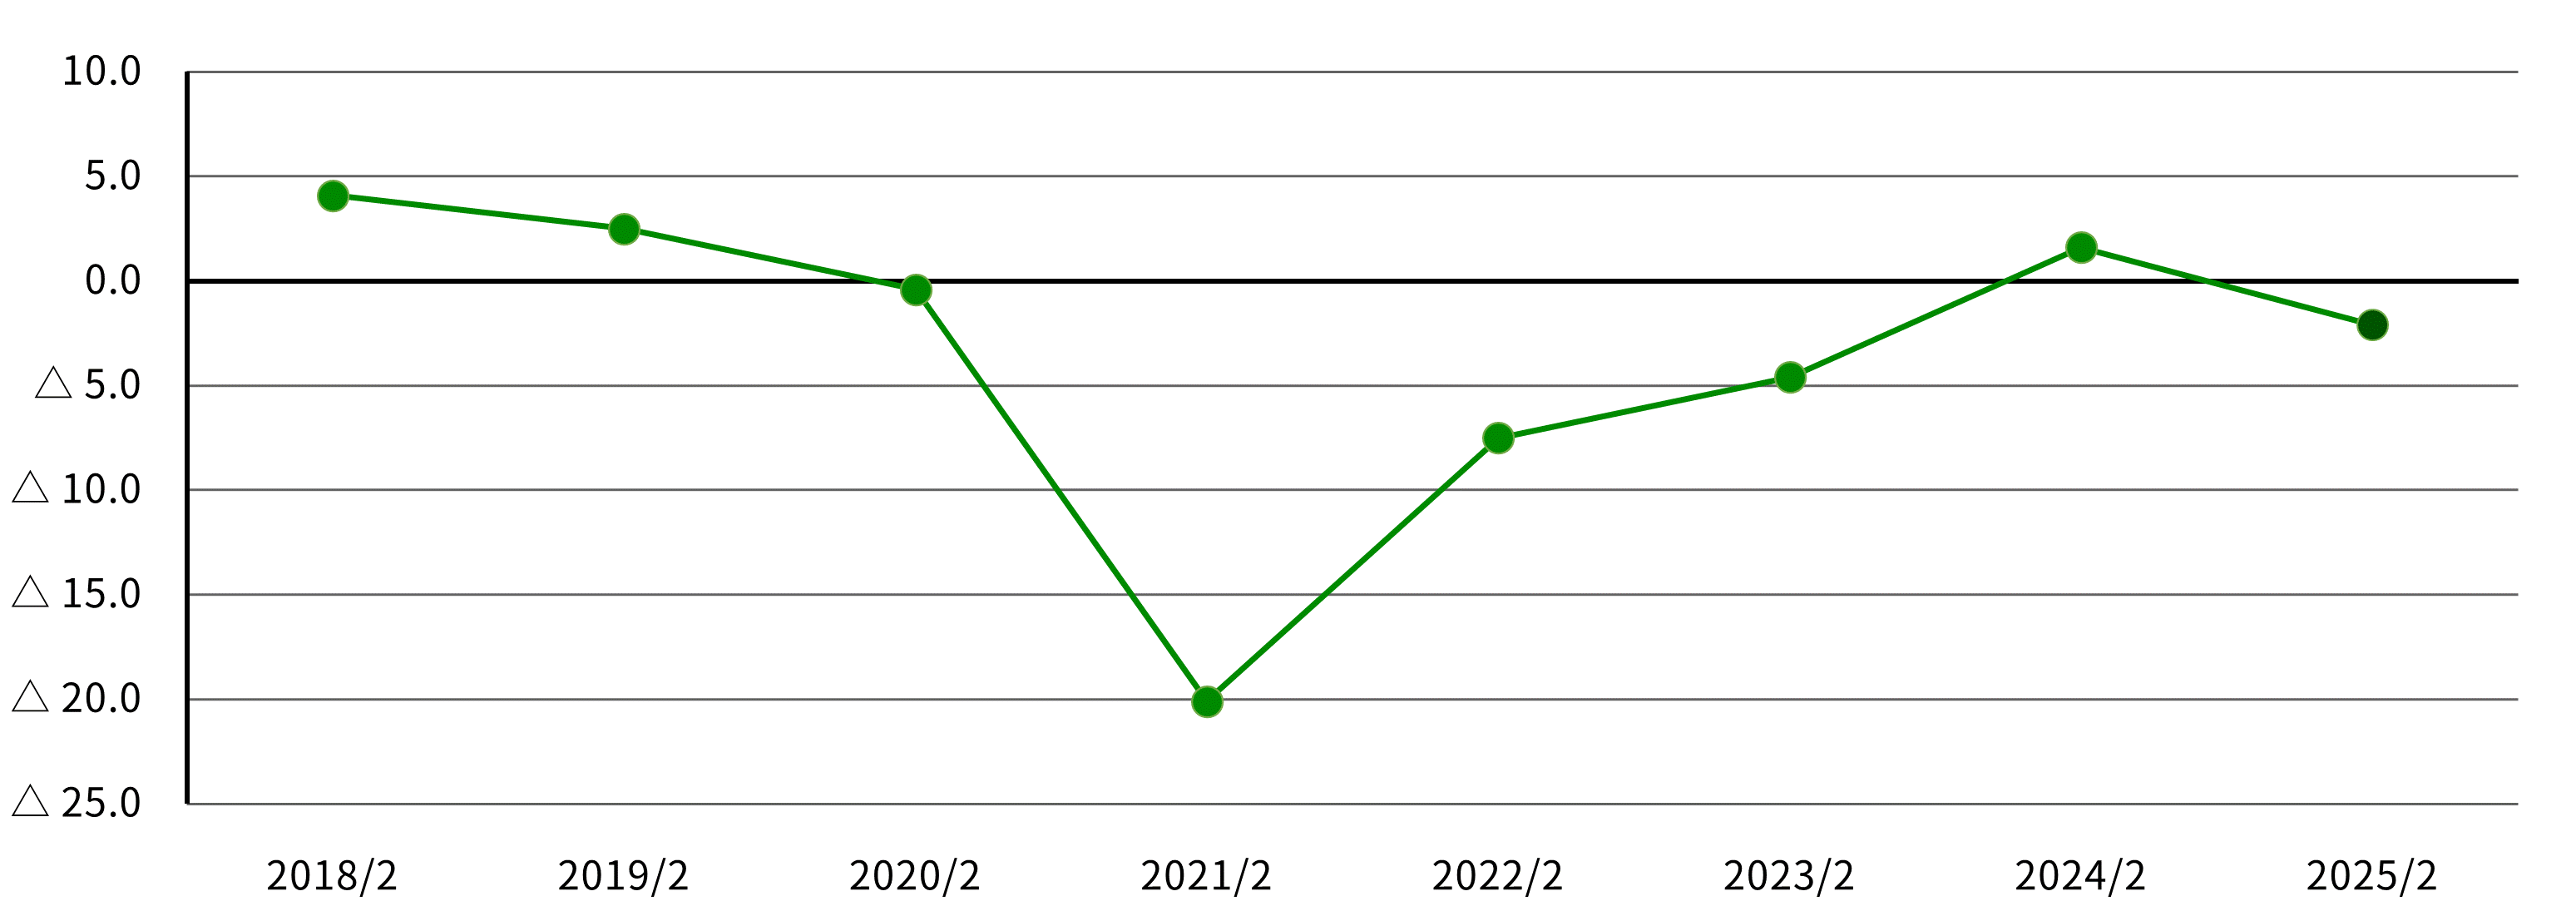
| 売上高当期純利益率 | 4.1 | 2.5 | △0.4 | △20.1 | △7.5 | △4.6 | 1.6 | △2.1 |
※売上総利益率=売上総利益/売上高
※売上高営業利益率=営業利益/売上高
※売上高経常利益率=経常利益/売上高
※売上高当期純利益率=当期純利益/売上高
売上高総利益率
(単位 : %)

売上高営業利益率
(単位 : %)

売上高経常利益率
(単位 : %)

売上高当期純利益率
(単位 : %)

データダウンロード
2025年04月11日更新


