主な経営指標MANAGEMENT INDICES
キャッシュ・フロー関連指標(連結)
(単位 : 百万円)
| 第22期 2018/2 |
第23期 2019/2 |
第24期 2020/2 |
第25期 2021/2 |
第26期 2022/2 |
第27期 2023/2 |
第28期 2024/2 |
第29期 2025/2 |
|
|---|---|---|---|---|---|---|---|---|
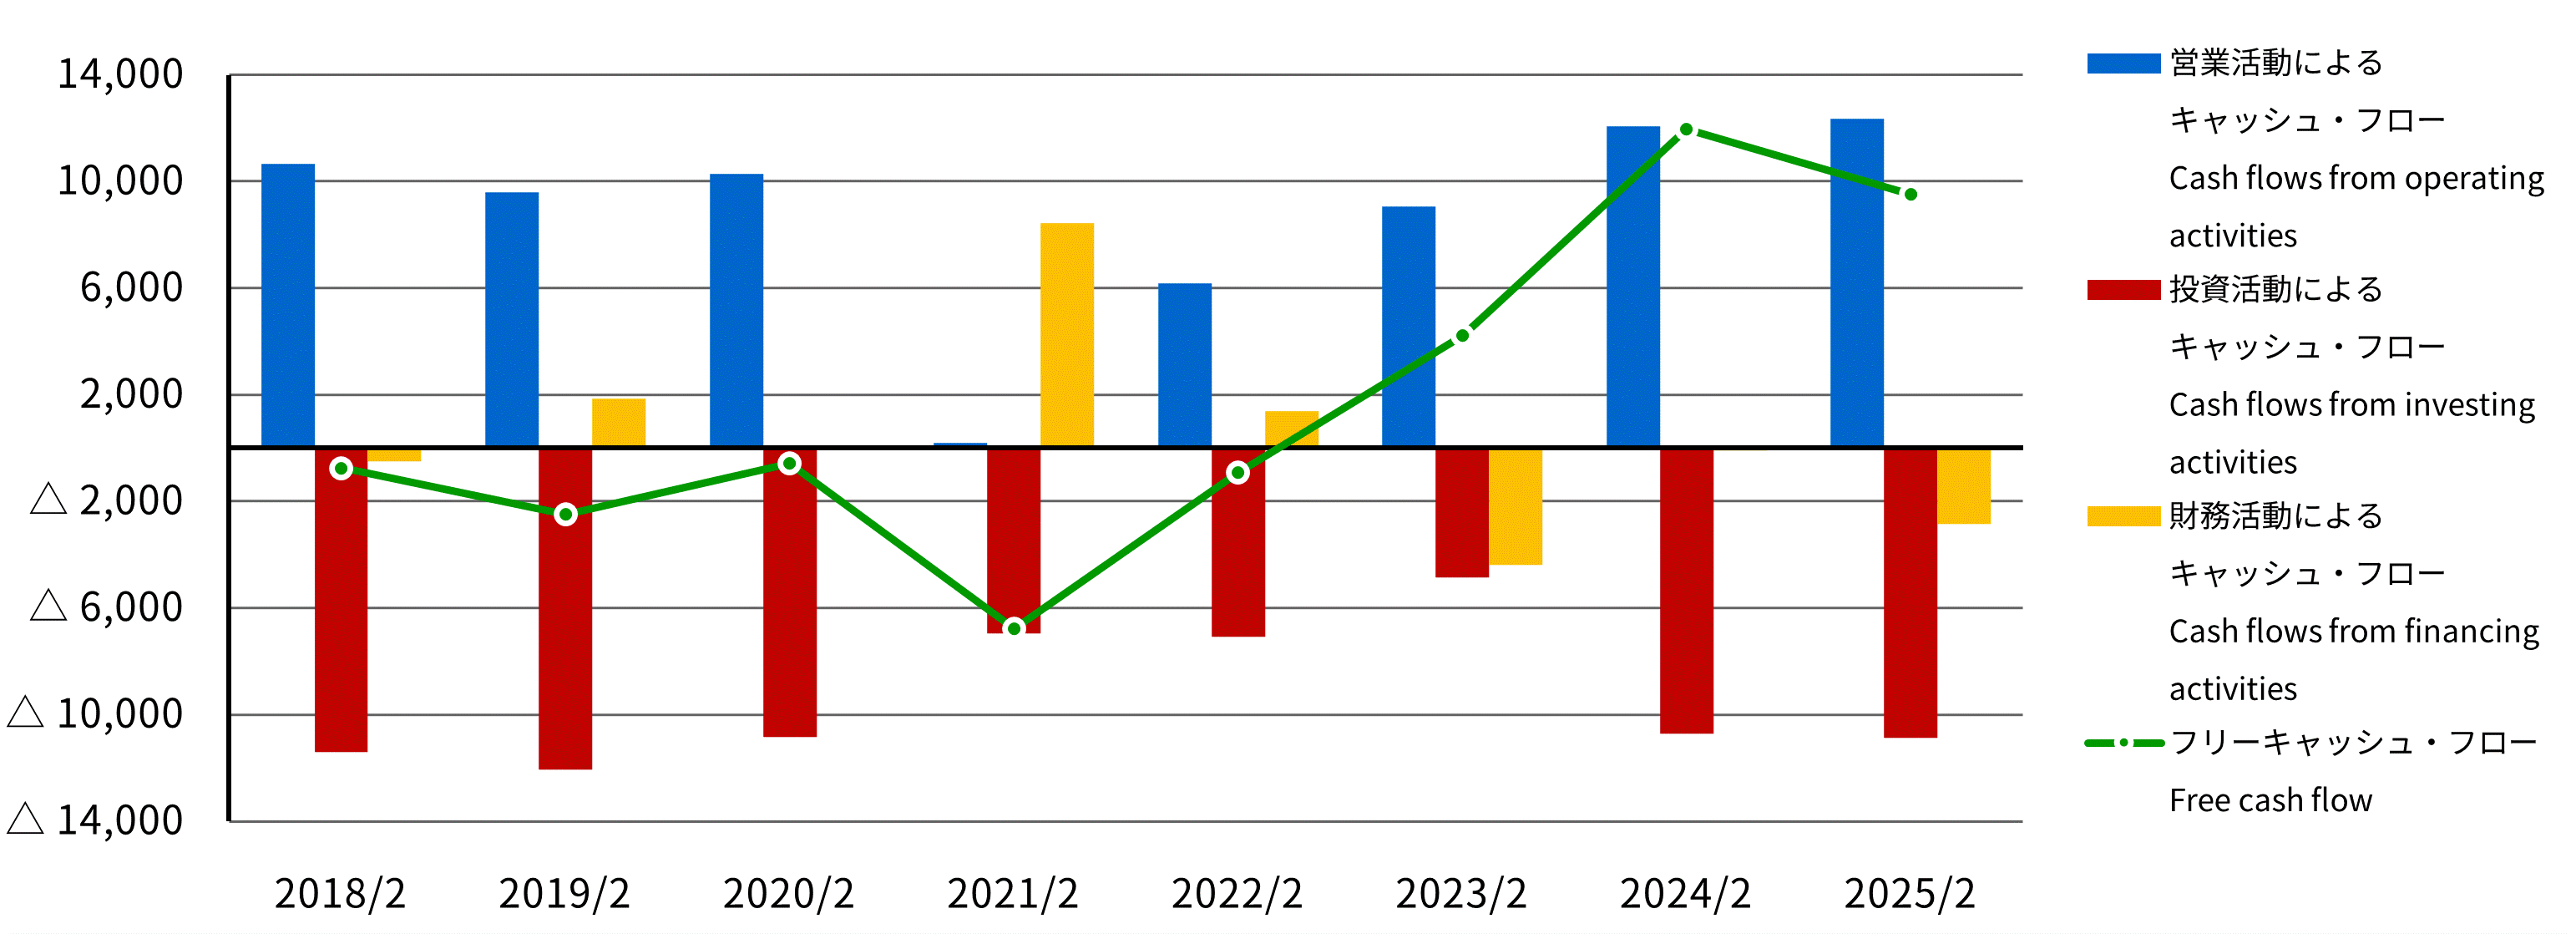
| 営業活動によるキャッシュ・フロー | 10,672 | 9,588 | 10,271 | 183 | 6,176 | 9,057 | 12,056 | 12,353 |
| 投資活動によるキャッシュ・フロー | △11,416 | △12,069 | △10,849 | △6,964 | △7,091 | △4,845 | △10,725 | △10,858 |
| 財務活動によるキャッシュ・フロー | △506 | 1,862 | 96 | 8,445 | 1,395 | △4,379 | △97 | △2,841 |
| フリーキャッシュ・フロー | △744 | △2,480 | △578 | △6,781 | △914 | 4,212 | 11,959 | 9,512 |
| 減価償却費 | 7,206 | 8,356 | 10,815 | 10,698 | 10,518 | 10,063 | 10,043 | 10,756 |
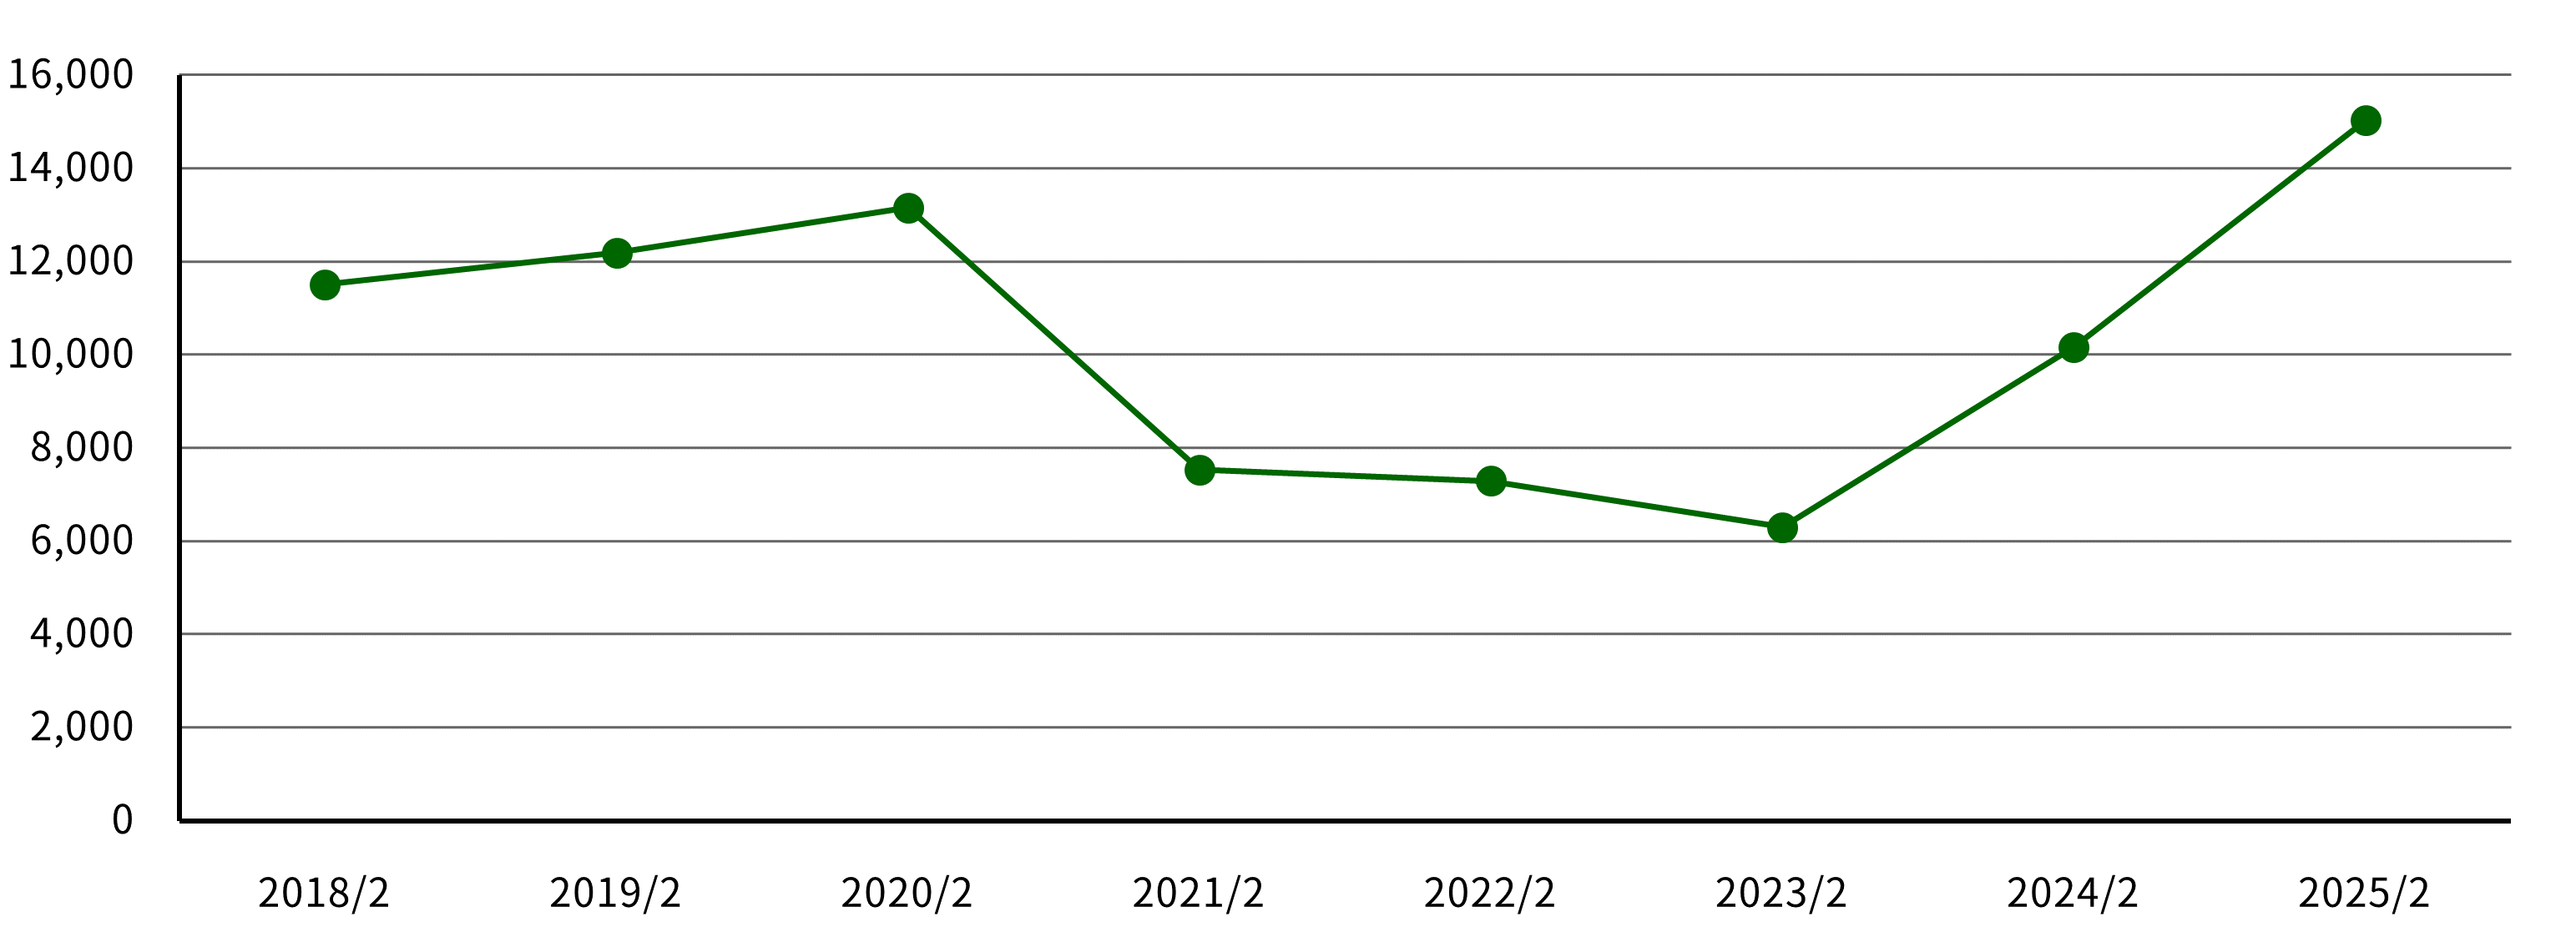
| 設備投資 | 11,510 | 12,187 | 13,159 | 7,529 | 7,289 | 6,298 | 10,164 | 15,029 |
※フリーキャッシュ・フロー=営業キャッシュ・フロー+投資キャッシュ・フロー
キャッシュ・フロー関連指標
(単位 : 百万円)

減価償却費
(単位 : 百万円)

設備投資
(単位 : 百万円)

データダウンロード
2025年04月11日更新


